The main window
The window is a frame around six panels. There is no fixed layout: every panel can be moved, resized, closed, or dragged out into a window of its own, and where you leave them is where they are next time.
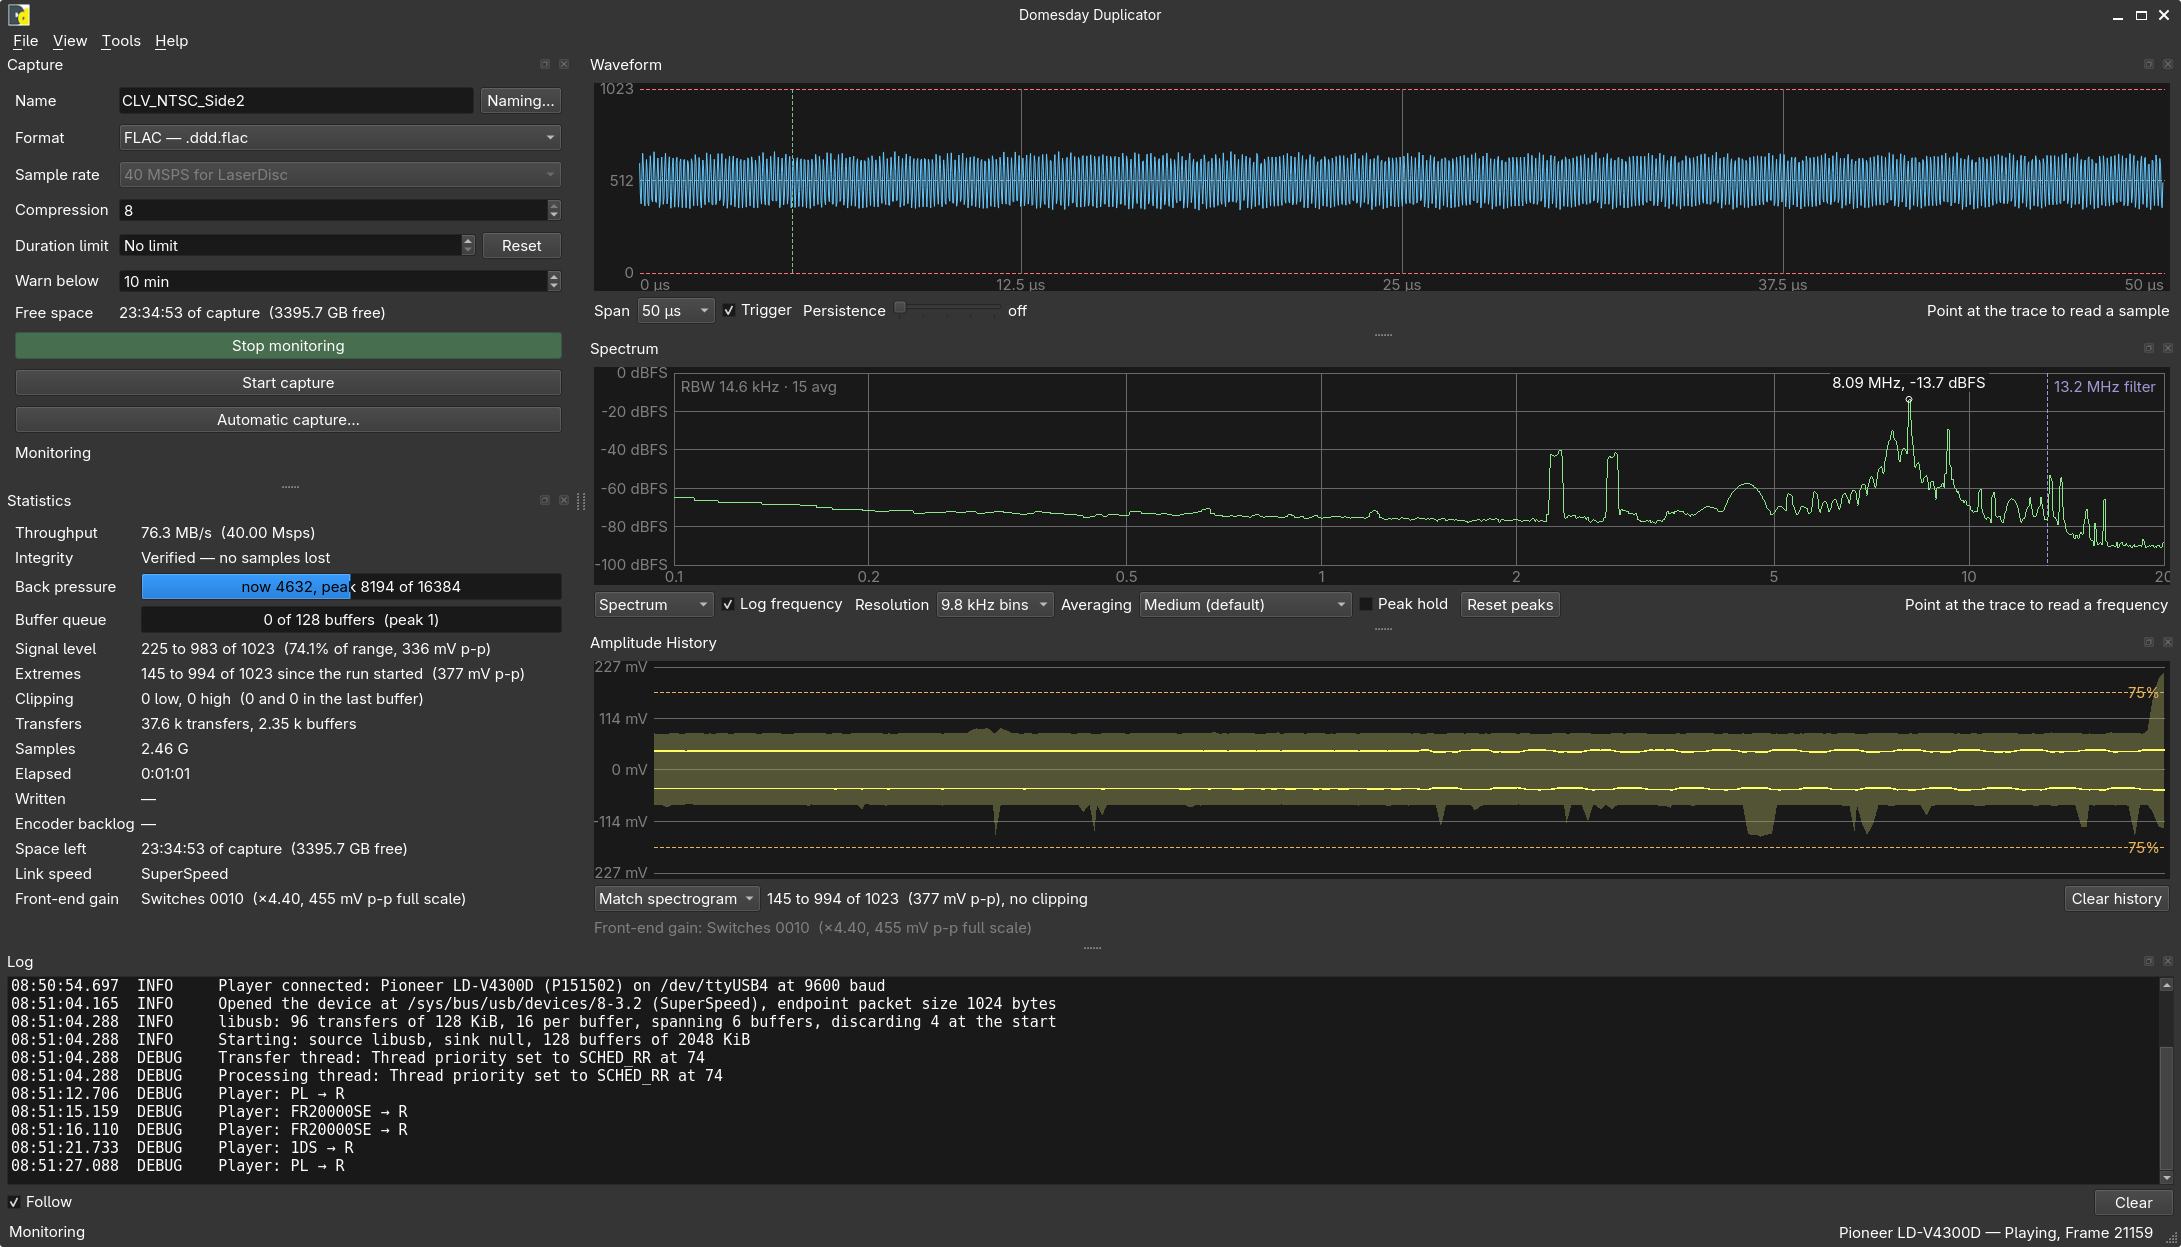
The panels
| Panel | What it is for | Where it starts |
|---|---|---|
| Capture | What the capture is called, what it is written as, and the buttons — see Capture control | Left, top |
| Statistics | What the run is doing, second by second — see Statistics | Left, below Capture |
| Waveform | Do I have a signal? The scope: the signal right now — see Signal analysis | Right, top |
| Spectrum | What is the signal? What it is made of, live or over time — see Signal analysis | Right, middle |
| Amplitude History | Can I capture it? The level, over the last five minutes — see Signal analysis | Right, bottom |
| Log | Diagnostics | Bottom, hidden |
The three signal panels start down the right-hand side in that order because that is the order the questions come in: whether there is a signal, what it is, and whether it can be captured well. Each is worth asking only once the one above it has been answered, and The three questions is the short version of why. Rearranging them costs nothing — the order is a default that reads top to bottom, not a constraint.
The Log panel starts hidden on purpose: it is a diagnostic view, and the first thing a new
window should show is the signal rather than the plumbing. View ▸ Panels ▸ Log reveals
it, and so does starting the application with --debug.
Rearranging
Drag a panel by its title bar to move it. Panels can be dropped beside one another as well as above and below, so a side-by-side scope and spectrum is a matter of dragging one onto the other's edge. Drag one outside the window and it becomes a window of its own — useful on a second screen, where a spectrogram can be given the width it deserves.
View ▸ Panels lists all six with a tick beside each. The list is built from the panels themselves, so closing one with its own title-bar button unticks it here, and there is no way for the two to disagree.
The window's size, position, and the whole arrangement — including which panels are floating and which are hidden — are saved when the application closes and restored when it opens.
Themes
View ▸ Theme offers Auto, Light and Dark. Auto follows the desktop's own light/dark setting and changes with it while the application is running.
Everything the application draws itself — the scope trace, the spectrogram colours, the green on an active button, the pass or fail verdict on a test analysis — is drawn from the window's own palette, so a theme switched in the middle of a capture recolours the displays rather than leaving one theme's colours on the other's background.
The status bar
The status bar says the same thing the Capture panel does, because the Capture panel can be closed and the status bar cannot. Someone who has hidden everything but the spectrum can still see that the device has been unplugged.
It shows, in order of precedence: the file being written during a capture, Monitoring while the stream is running, how many devices are attached, or why the attached device cannot capture.
When a capture ends it reports the file and its size there rather than in a message box. A capture ending is the expected outcome, and a dialog to dismiss after every one would be in the way of somebody taking both sides of a disc.
The menus
| Menu | Entry | What it does |
|---|---|---|
| File | Settings… | Settings |
| Exit | Closes the window, saving the layout | |
| View | Panels | Show and hide the six panels |
| Theme | Auto, Light, Dark | |
| Tools | Player ▸ Player control | Look for a LaserDisc player — see Player control |
| Player ▸ Search now | Look for the player again straight away | |
| Player ▸ Remote control… | The player window: transport, connection, disc codes, manual commands | |
| Player ▸ Examine disc… | Find out what is in the player, and report it | |
| Player ▸ Automatic capture… | Examine, name, capture a side, and see what was written | |
| Test data ▸ Test data mode | Capture the gateware's test pattern instead of the RF input — see Test mode | |
| Test data ▸ Analyse test data… | Check a test-mode capture off the disk | |
| Firmware ▸ Update firmware… | Which build each part of the device is running, and the Update page — see Updating your Duplicator | |
| Firmware ▸ Bring up a new or legacy board… | Programs a board from nothing to fully up to date — a newly built one, one running the original firmware, or one in any state at all. See Bringing up a new or legacy board | |
| Help | About | The build this binary was made from |
Tools holds three submenus and nothing loose: Player for the other machine on the bench, then Test data and Firmware for this one. The player is there rather than in a menu or a panel of its own because almost everybody has one player, set up once and never touched again: it is a tool rather than something that earns permanent screen space. Whether it is connected is on the status bar, which cannot be closed.
Player settings — model, port, speed — are on the Player tab of File ▸ Settings… rather than repeated here. This menu is what you do to a player; that dialog is what you set about one.
The entries that need a player to do anything — Remote control…, Examine disc… and Automatic capture… — are greyed out until one is connected. When nothing is, the status bar is what says so.
Both Firmware entries are greyed out the other way round: while a capture is running. Everything behind them resets the device, rewrites its flash or reconfigures its FPGA, and a capture is a bulk transfer from that same device — so stopping a recording that may be hours old is left as your decision rather than made a side effect of opening a menu. Monitoring is the other case entirely: nothing is being written, so opening either window simply puts it down and closing the window picks it up again.
Help ▸ About carries the same commit --version prints, and that is deliberate rather
than duplication: the Windows build has no console of its own, so for anyone who started the
application from a desktop shortcut the dialog is the only way to identify a binary. If you
are reporting a problem, that is the string to quote — along with the device's two, from
Tools ▸ Firmware ▸ Update firmware….
The Log panel
Every diagnostic the application produces arrives here, timestamped, in a fixed-pitch font so the columns line up. Follow keeps the newest record in view; Clear empties it.
Records can be copied out. Click one to select it, shift-click or drag for a range, and Ctrl+A for all of them; Ctrl+C or right-click ▸ Copy puts what is selected on the clipboard as the lines shown here — which is how to paste a handful of records into a bug report without attaching a whole log file.
Level sets the lowest severity that is recorded: debug, info, warning, error, or off,
which records nothing. It is the same threshold
--log-level sets, so it governs the console and the
log file as well as this panel, and it takes effect from the moment it is changed — records
already listed stay listed when the level is raised, and a record dropped while the level
was high does not reappear when it is lowered.
By default it records informational messages and above. Starting with
--debug lowers that to debug level and shows the panel at startup,
which is what to do before reproducing a fault you intend to report;
--log-level sets the level at startup, and the
Level drop-down changes it while the application is running.
The panel is one of the log's destinations and not the only one. The same records go to the
console the application was started from, and to a file when
--log-file named one — which is the copy to attach
to a report, since this panel closes with the application.